
Analyze data without SQL or engineers
Build driven organizations without technical skills. Generate comprehensive dashboards and visualizations using excel-like spreadsheet syntax. Easily run queries using SQL or a no-code GUI.


Used by the world's most innovative teams
“Sourcetable has pulled back the veil allowing us to see, in nearly real time, how our strategies affect results. Thank you, Sourcetable!”

“We've been able to increase our ROI and get quicker feedback on where to spend more, when and where to pull back.”

“It's just about streamlining analytics. So, if we can have analytics from multiple platforms in one place, that just saves us tons of time and energy.”

Turn ad-hoc data requests in a self-service system
Collaborate on meaningful insights with your team
Access reliable data quickly
Introducing: Sourcetable Templates for analysts
Enjoy our carefully curated templates to track, monitor, and act on critical metrics for your executive team. Sourcetable Templates combine industry expertise, best practices, and years of experience creating and growing data-driven organizations worldwide. Make better decisions with Sourcetable Templates.
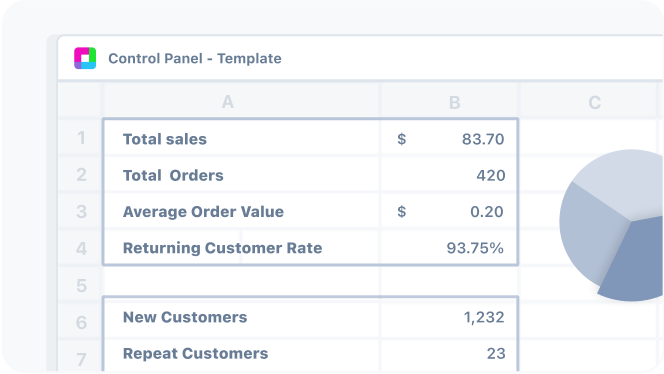
Company control panel
This template can help you consolidate marketing, sales, and product data in one place, enabling data-driven decisions across the company.
View Template
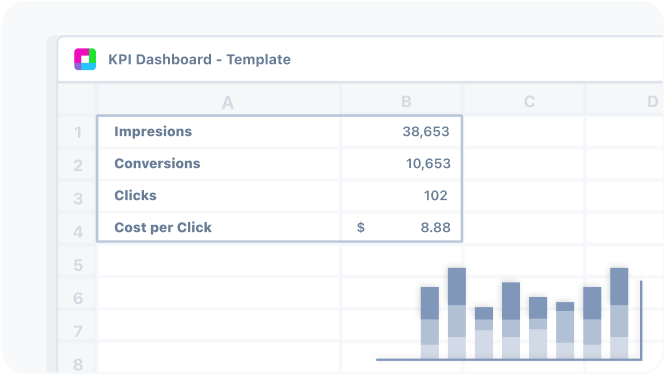
KPI dashboard
Help your executive team set achievable goals based on past performance and ensure the company is on track — monitor metrics at the department and company levels.
View Template
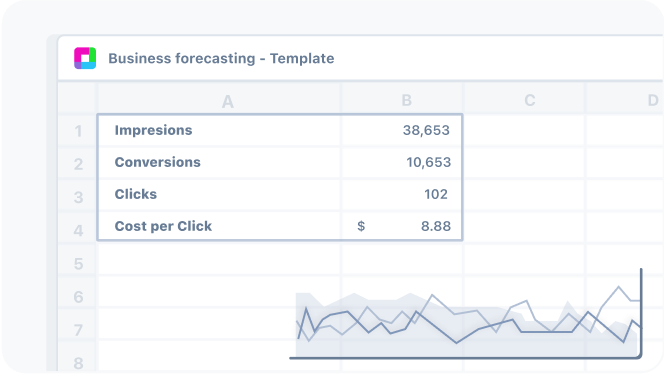
Business forecasting
Enable data forecasting in marketing, sales, finance, and product departments with auto-updating models like revenue and deal flow forecasting. Reliably forecast your retention and engagement with data.
View Template
What makes Sourcetable
special?
Zero learning curve
Sourcetable allows you to work with multiple data streams in a spreadsheet interface using A1 notation. If you know your way around Excel - you'll love Sourcetable.
Reliability and security
Underneath the spreadsheet interface, Sourcetable also provides a data warehouse, where all data flows are encrypted to provide maximum security for your data.
Automated reports and collaboration
Be on the same page with your team: invite them to your dashboards, and receive automated reports on key metrics for your department.
All-in-one data platform
Sourcetable is a spreadsheet with a data warehouse. Connect, sync and query all of your data in one place, without needing engineers.
Live data
Everything in Sourcetable is always up to date. Stop exporting static CSV files and start building models from live data flows.
Single source of truth
Aggregate data from multiple systems and databases to build a reliable reporting infrastructure.


